
Market direction is often guided by market structure.
Market structure is a concept that is important for traders to understand as it can influence the liquidity and price action of a market. It is the simplest form of price movement in the market and is used to identify overall market conditions. Market structure is also referred to as price action and is a trend-following tool that traders read and follow based on how an asset moves. It is a high-level concept that allows traders to understand trends, identify potential reversal points, and get a feel for current market conditions.
To analyze market structure, traders need to identify higher highs, higher lows, lower highs, and lower lows. These four basic structures are used to understand the direction of the price of an asset using a zoomed-out view.
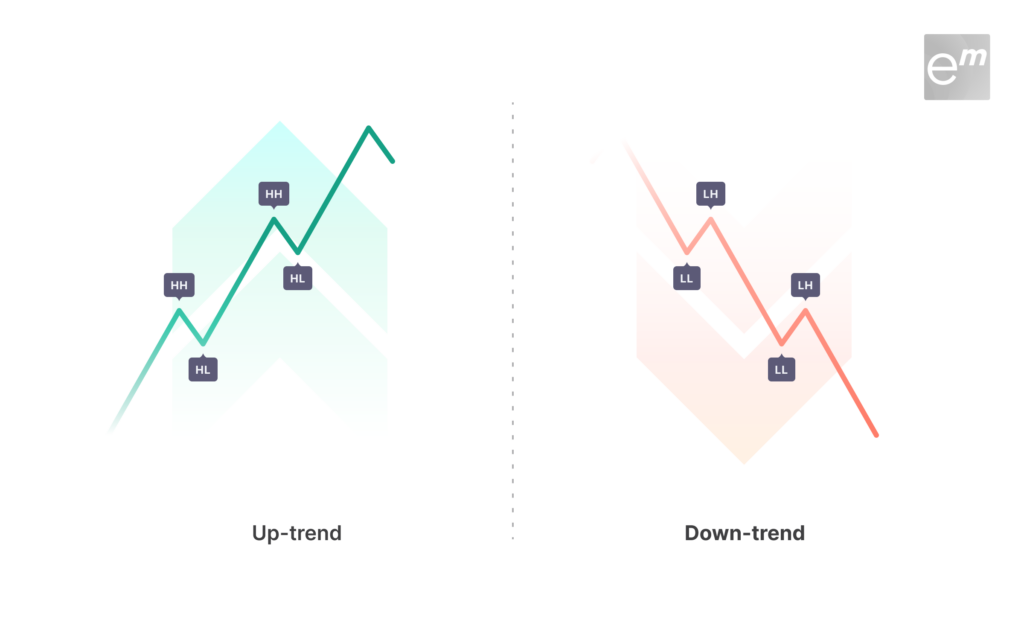
Bullish, bearish, and sideways/ranging are the three main types of market structure.
When the price prints consecutive higher highs and higher lows, it is bullish. On the other hand, the market structure is bearish when consecutive lower highs and lower lows are printed.
Advantages of understand Market Structure
Using market structure in trading has several advantages. Firstly, it provides traders with a clear overview of current market conditions and trends, allowing them to identify support and resistance levels. Secondly, market structure helps traders to understand the market sentiment. Thirdly, market structure can be used to identify potential reversal points and predict future price movements. Finally, market structure is a simple and basic form of understanding how markets move, making it an essential tool for traders to read and analyze market data. Overall, using market structure in trading can help traders make informed trading decisions and increase their chances of success in the market.
Traders either use the top-down approach or the bottom-up approach. The top-down approach is often used by short-term traders, while the bottom-up approach is used by long-term investors. { Know more about top-down – bottom up approach in this blog. }
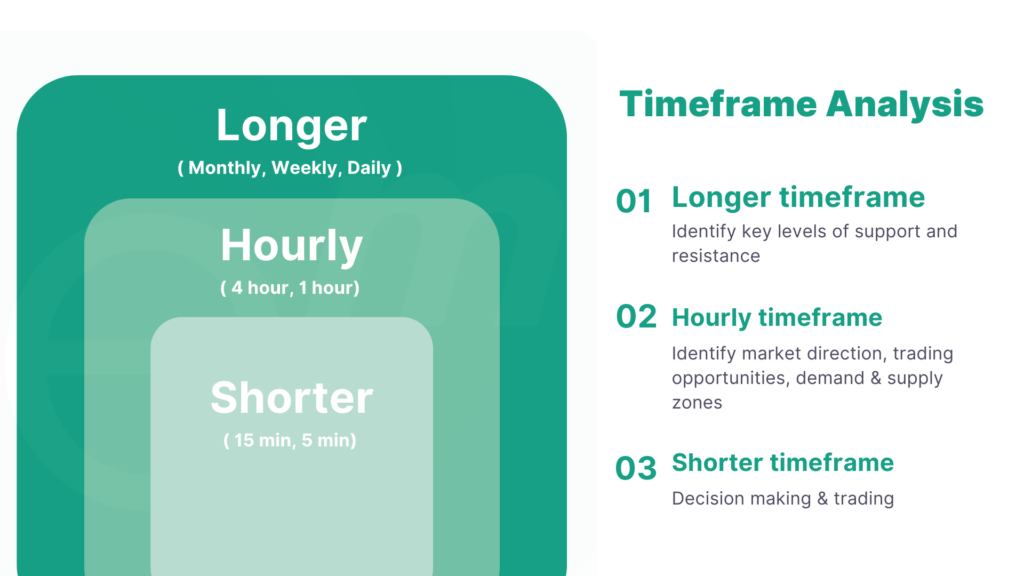
Timeframe Analysis
Traders also need to consider the time frames and technical indicators they want to use. Technical indicators can be used to determine market direction or market strength. Technical traders analyze price charts to attempt to predict price movement. The time frame a trader selects to study is typically determined by that individual trader’s personal trading style. Intra-day traders favor analyzing price movement on shorter time frame charts, such as the 5-minute or 15-minute charts. There are also technical indicators whose main purpose is to determine market strength, such as the Stochastic Oscillator and the Relative Strength Index.
Overall, understanding market structure & using timeframe analysis help traders make informed trading decisions and increase their chances of success in the market.